Background
In the "Strawfish" pre-lab, the students were given a paper bag filled with equal amounts of blue and yellow straw pieces. The straws represented the alleles (blue and yellow) of the strawfish. Through the simulation of "random mating", or picking two alleles out of the bag without looking until the bag was empty, the control group (generation 1) was determined. There are three phenotypes: blue (BB), green(BY or YB), and yellow (YY); when the blue and yellow alleles are inherited together, they make incomplete dominance, the heterozygote is a green-colored fish.
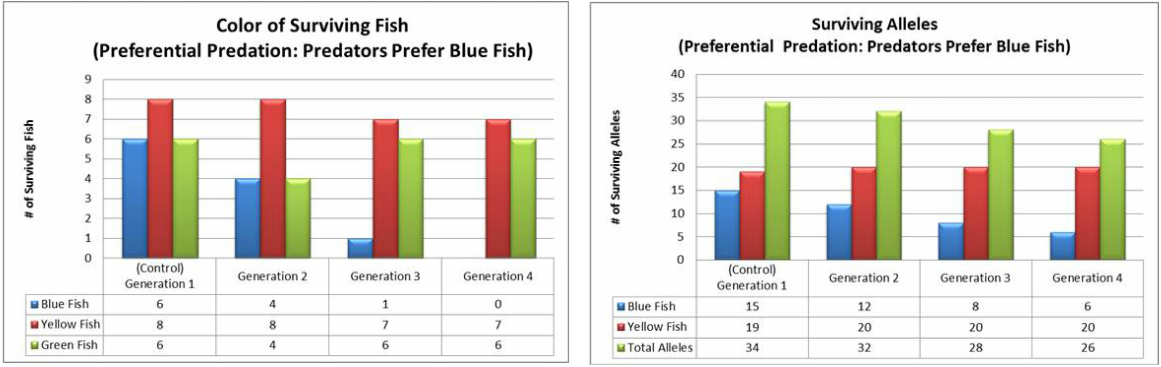
Each generation was chosen by "random mating" (picking two straws or alleles out of the back at random) which determined the phenotype -- blue, green, or yellow -- and genotype, BB, BY or YB, or YY. Each allele and surviving fish were recorded into a table. In test one, the first generation served as a control group for the four generations. After the first generation, every other blue fish was eaten by a predator; this drastically decreased the blue fish population, however the yellow fish and the green fish survived by the fourth generation, unlike the blue fish. But, because the green fish are BY, they have preserved the blue fish allele to survive.
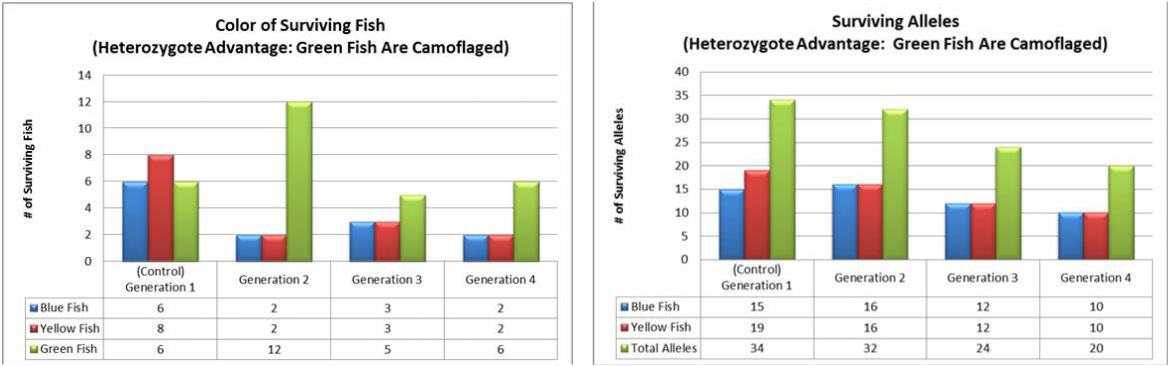
In test four, the green fish were camouflaged while predators ate every other blue and yellow fish; the control group was the same as test one. The blue and yellow fish population equally decreased within the fish population, however their alleles are preserved within the green fish population. This means that the blue fish or yellow fish population is not extinct, but preserved.
Each generation was chosen by "random mating" (picking two straws or alleles out of the back at random) which determined the phenotype -- blue, green, or yellow -- and genotype, BB, BY or YB, or YY. Each allele and surviving fish were recorded into a table. In test one, the first generation served as a control group for the four generations. After the first generation, every other blue fish was eaten by a predator; this drastically decreased the blue fish population, however the yellow fish and the green fish survived by the fourth generation, unlike the blue fish. But, because the green fish are BY, they have preserved the blue fish allele to survive.
In test four, the green fish were camouflaged while predators ate every other blue and yellow fish; the control group was the same as test one. The blue and yellow fish population equally decreased within the fish population, however their alleles are preserved within the green fish population. This means that the blue fish or yellow fish population is not extinct, but preserved.
Test #1 --
Total Number of Fish per Generation:
1: 20
2: 16
3:14
4: 13
Test #4 --
Total Number of Fish per Generation:
1: 20
2: 16
3: 12
4: 10
Hardy-Weinberg Equilibrium Equation
Mathematical Model:
~ p^2+2pg+q^=1 (represents the combinations of alleles or genotypes)
~ p (AA) = frequency of dominant allele
~ q (aa) = frequency of recessive allele
~ p+q=1
Conditions That Must Be Met To Apply Hardy-Weinberg Principle:
~ No Mutation
~ Must Be Random Mating
~ No Selection Pressure
~ Must Have Large Population Size
~ No Gene Flow (No Immigration or Emigration)
~ Rarely Do All of These Things Exist at Any Given Moment, But Over Time, Populations Tend To Be In Equilibrium
Cases 1 and 2
Case 1:
The class, heterozygous (Aa) individuals with an intial gene frequency of p=5 and q=5 before breeding, represented a random breeding population. In order to simulate random breeding, the students chose one another at random for five generations. Each student was given two cards that represent gametes. One card had "A" and the other had "a". Each student/parent contributed one gamete to each offspring/generation.
Calculations:
A (p) = 174/289 = 0.6
a (q) = 115/289 = 0.4
Class Allele Frequencies:
AA = 0.36 Aa = 0.48 aa = 0.16
Case 2:
The procedure in case 2 was the same as case 1 except the homozygous recessive (aa) individuals never survived, while the others survive (AA and Aa).
Calculations:
A (p) = 220/334 = 0.7
a (q) = 114/334 = 0.3
Class Allele Frequencies:
AA = 0.49 Aa = 0.42 aa = 0.09
Conclusion
~ Why did case 1 our data not match the initial HW?
Our class size is small. Therefore, the conditions for the Hardy-Weinberg equation to stay at equilibrium is hindered by the lack of a large population size.
~ Source of Error:
1. Individuals counting incorrectly
2. Multiple people switching cards with the same people over again which limits "random mating"
3. Some one having the wrong genotype before "mating" with another student
